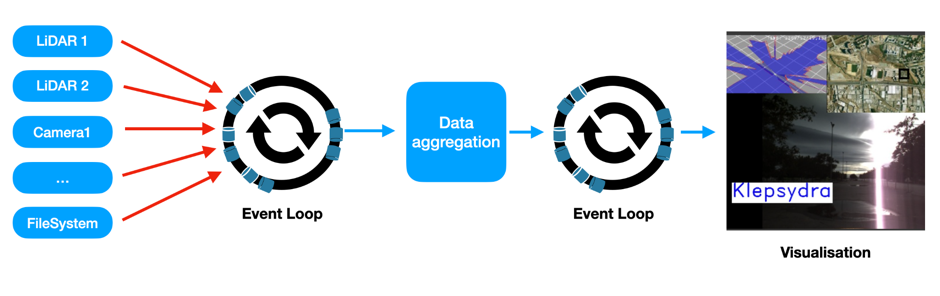
This demo is about data aggregation in an environment where there are many sources of data and limited computer resources. In this particular case, the demo shows how to collect this data in a car and process it in an orderly manner. The sensors used are similar to those available in self-driving cars.
Data aggregation means compiling data from multiple sources, uniformising it and delivering it in the same coordinate systems in a manner that a concrete application (safety system, navigation, etc) can understand. The data arrives at different rates and formats provided by each sensor vendor.
While most sensor vendors somewhat follow certain conventions, the quality of the incoming data might vary: some sensors send data fast and of high quality, others send data slower and of low quality. Moreover, each vendor offers a specific data format, for example sampling in coordinates XYZ, or in distances and angles, etc.

What does the data aggregation demo proves?
This demo shows how Klepsydra SDK is really beneficial when there are large volumes of data coming from many different sensors.
By comparing the way Klepsydra can aggregate data versus how traditional systems do, the demo shows that the throughput is substantially higher, and the real-time response is much better with Klepsydra. On the other hand, processing a piece of data with traditional systems could take long, causing delays. These delays mean that the system is not able to accept all the incoming data and there is an increasing amount waiting in a queue for their time to be processed. Eventually, some of this sensor data may be lost. These are reasons why traditional systems cannot be trusted to do automotive critical applications.

Understanding the demo
The demo has four main parts in the screen:
- The top left shows the CPU usage. Klepsydra needs roughly 1/3 less CPU than the conventional system.
- The left bottom shows the throughput. Klepsydra data rate remains constant.
- On the right side there are two charts, which is the output of the visualisation tool presenting all the sensor data: the top one shows Klepsydra and the bottom one shows the traditional system.
Looking at the demo and the graphical statistics presented, the system is very stable with Klepsydra, and it can run for a long time.
Explaining the demo: data aggregation
The data used in this demo corresponds to a set of data recorded by a team of the University of Malaga driving a research vehicle around the city. The recording lasts for 20 minutes which is the same duration of the demo.
In this demo there are two cameras, five 3D LiDARs producing data for not only one single point but many points in a plane, also a GPS, and one IMU, (Inertial Measurement Unit) that gives information about linear and rotation movement.

There is an initial phase in the demo where only two LiDARs are producing data. After a few seconds, the other three LiDARs start to produce data as well. At this point when with the traditional systems the data that is fed into the visualisation tool drops substantially from approx. 40 events per second down to 5, while Klepsydra keeps constantly feeding the systems at the same rate, i.e., 40 frames per second.
Halfway through, the traditional system starts to freeze, the images are no longer refreshed at the correct rate. There is a delay of several seconds, and at the end in the order of minutes, for the images to be refreshed, whereas with Klepsydra the images keep refreshing in real-time.
At the end, Klepsydra finishes immediately, while the conventional system keeps processing for a while until it catches up with all the data that could not be processed on the on real-time.
In short, Klepsydra is always presenting the latest data without losses and no delays.
How to run the online demo
Step 1
The following link has to be used to start the DEMO:
https://nonspace.demo.klepsydra.com/data-aggregation-admin/
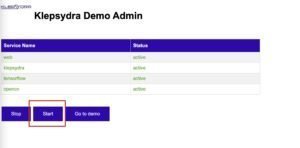
Firstly, go to the link and wait 5 seconds for the table to show the status of the demo (active or inactive). If they are in green, the demo is running correctly. However, if they are red, the demo has stopped or finished (it lasts 20 mins). If the demo is not active (RED), then press the start button and wait 5 seconds for the demo to start:
Step 2
If all four boxes are green, including the text OK, it means the demo was started correctly. After the demo is started and processes are running, press the “go to demo” button:
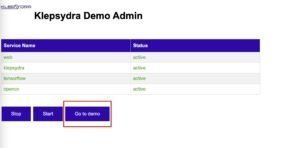
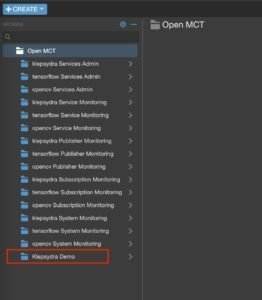
This button takes you to the following link: https://nonspace.demo.klepsydra.com/, which is an instance of NASA OpenMCT. OpenMCT is a real time monitoring web application that Klepsydra uses to access performance metrics. On the left, there is a menu. Select “Klepsydra demo”, which should be at the bottom:
Step 3
Once selected, a list of boxes will appear on the right. Click on the one named “Data Agreggation Demo”:
Data aggregation: Conclusions
Data aggregation is very important in automotive. A self-driving car or even a normal car may have 100 sensors or more and a small onboard computer inside.
This demo, initially oriented to automotive, can also be applied to the virtual reality and augmented reality world, where similar processes happen: many events of information that need to be processed and visualised.
This type of problem cannot be solved with bigger computers, because the main issue is not the computer power but data arriving simultaneously. With powerful computers the problem may remain unsolved, as shown in other sectors of the software industry. It has been proved that Klepsydra SDK can process all this data using only the existing computer.